The System Usability Scale
The SUS questionnaire is straightforward in its application for researchers and usability practitioners, validated through years of research and its application, available in numerous variants and languages (see our SUS PDF Generator), and easy to understand for participants.
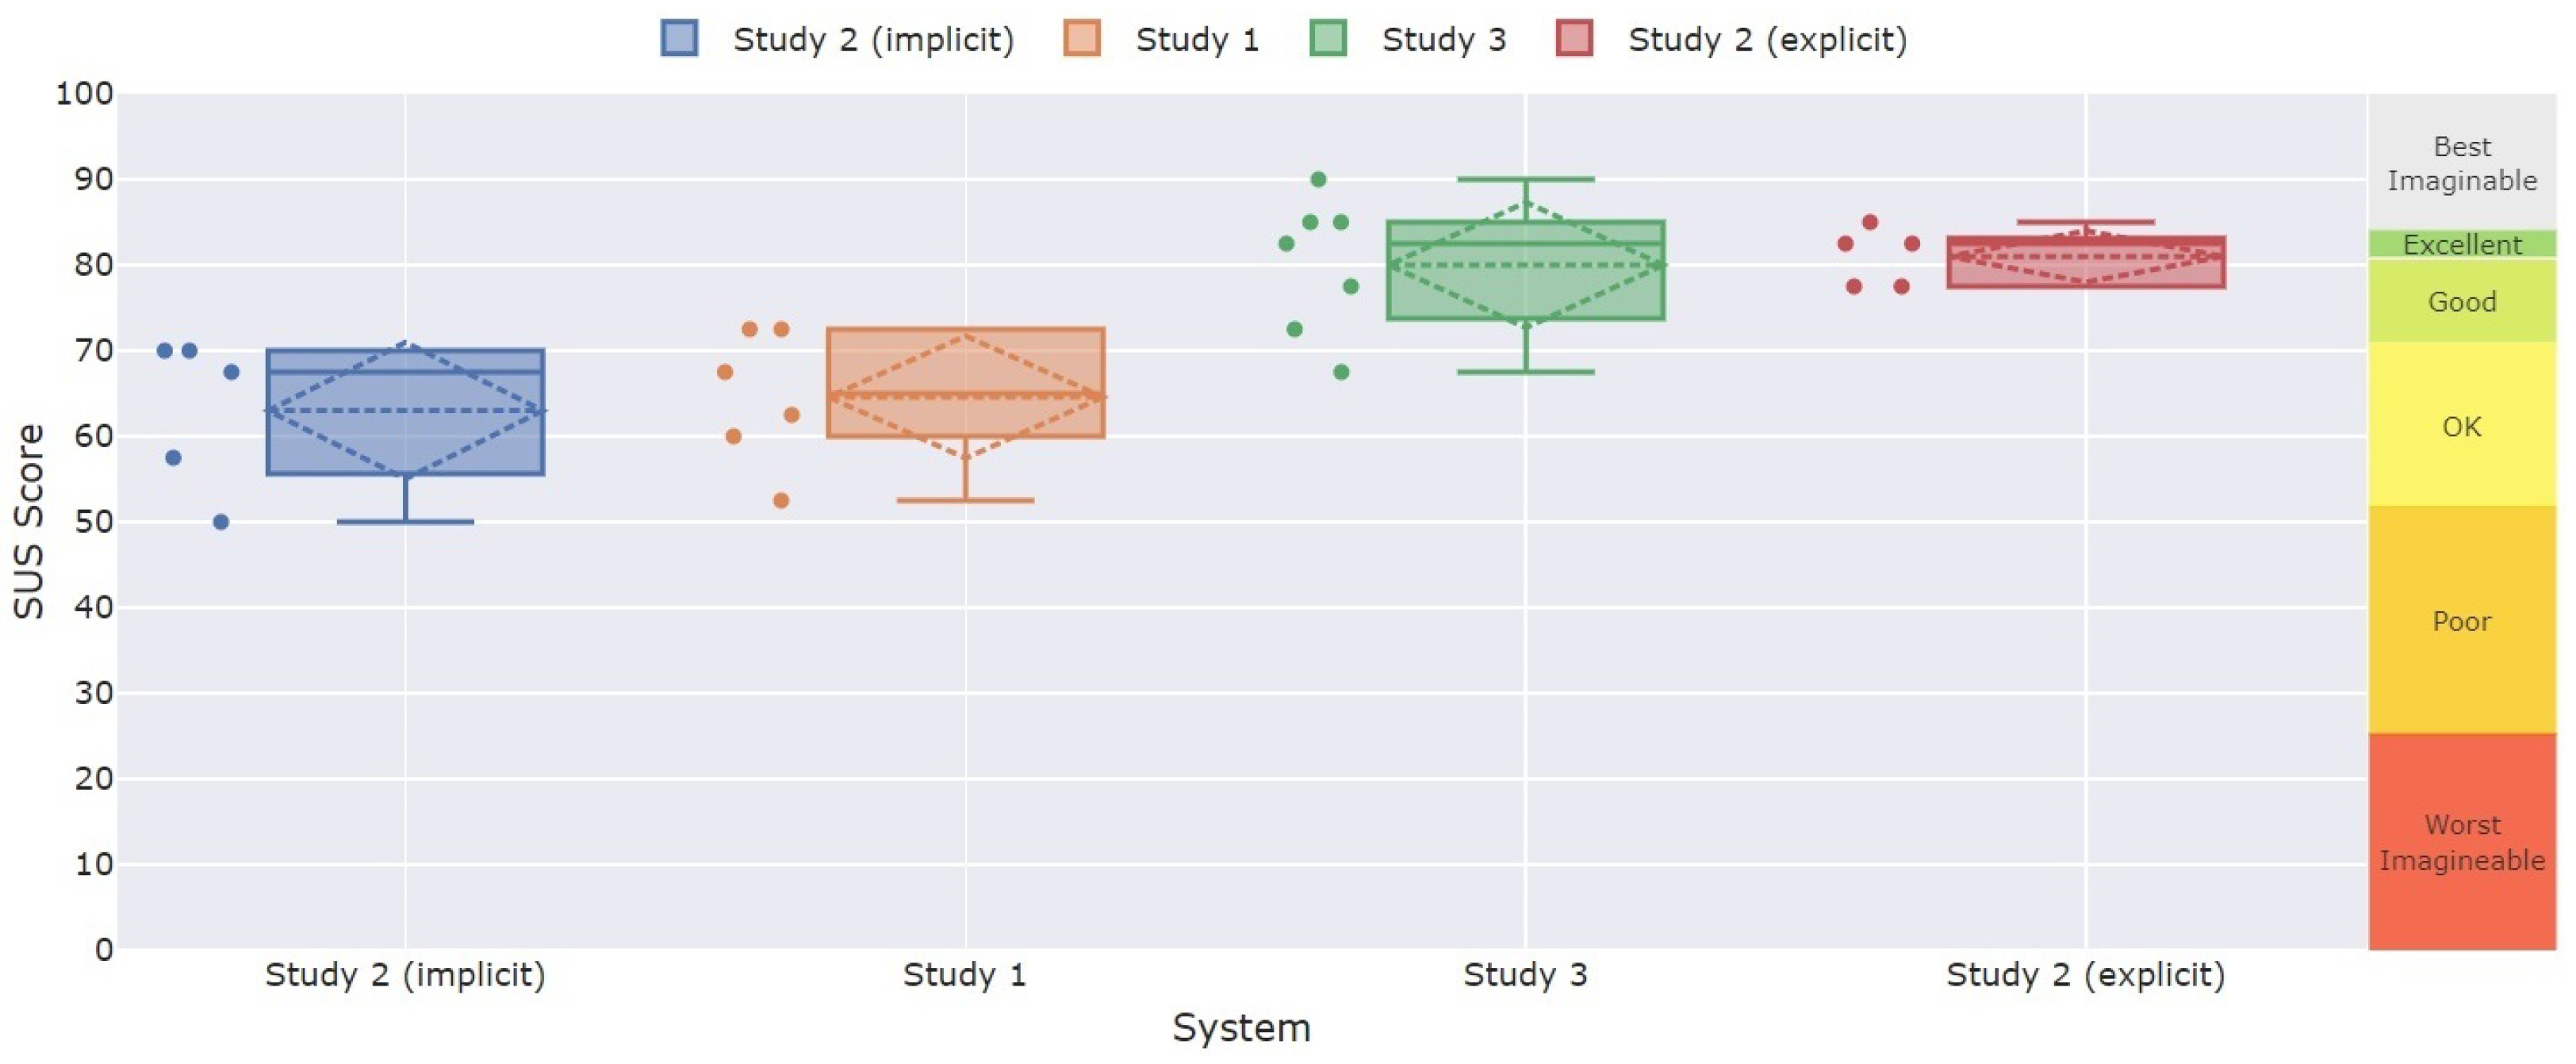
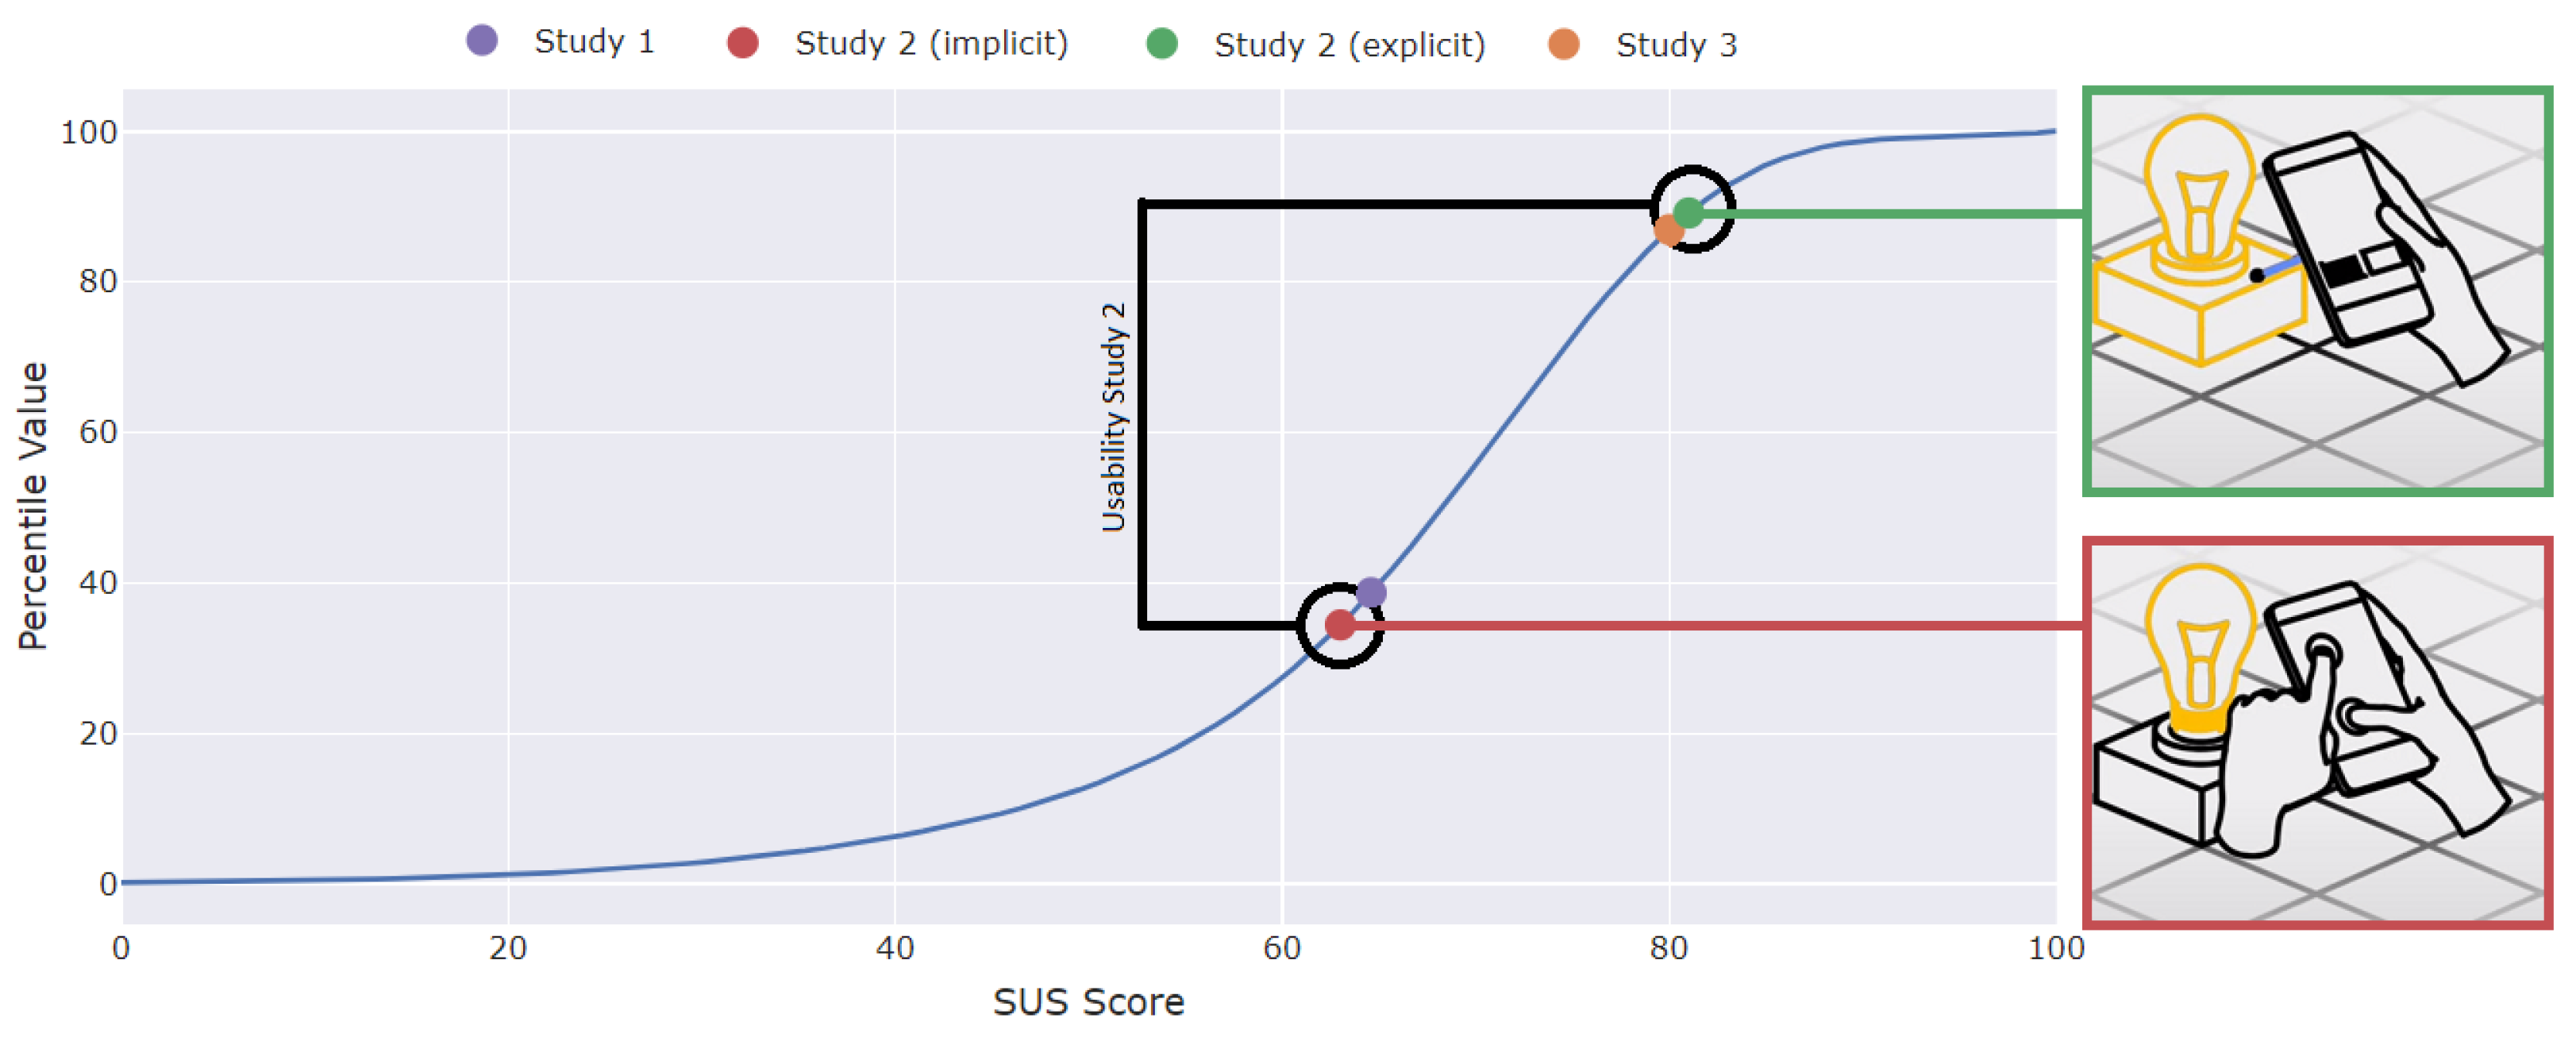
Throughout the years, researchers proposed approaches to contextualize SUS scores, trying to answer the question of what a specific SUS study score actually means. As they follow neither a normal nor a uniform distribution, they cannot be interpreted linearly, making it challenging to interpret them directly. Consequently, researchers calculated percentile curves of SUS scores from SUS study datasets, tried to contextualize SUS scores on adjectives, grading, net promoter score, quartile and acceptability scales, calculated at which point SUS scores become conclusive, and investigated the dimensionality of the SUS questionnaire.
The System Usability Scale Analysis Toolkit
Hereby, a special focus lies on producing "camera ready" quality figures for SUS studies that can be used in scientific publications and presentations.
Exemplary use cases of the SUS Analysis Toolkit:
- Calculating the SUS study score of a usability study for a product currently in development. Here, the "Single Study Dashboard" can calculate the SUS study score (and additional metrics like Media, SD, Min, Max, Quartiles), per Item averages, and the conclusiveness of the score based on the number of participants. It contextualizes the scores on the contextualization scales and provides a "dashboard" plot combining the most important information.
- Calculating and comparing SUS study scores from iterative (e.g. formative) usability studies during product development. Here, the "Multi Study Dashboard" can calculate the SUS study datasets metrics for each of the SUS study scores, contextualizes them, shows per Item comparisons and the conclusiveness of each iteration, and visualizes differences based on the SUS study dataset percentile curve.
- Comparing "SUS study scores" used as one of the independent variables in a scientific study to compare the perceived usability of different implementations, variations or products using the "Multi Study Dashboard" the same way as for the iterative study use case.


Project
The toolkit is hosted online under https://sus.tools. The full source code is available at https://github.com/jblattgerste/sus-analysis-toolkit/
If you find problems, bugs or want to provide feedback or suggestions, contact us through email or post your feedback as an issue on the GitHub project.
Feel free to contribute to our project through suggestions, feedback or by contributing to our open source GitHub repository through pull requests.
Acknowledgement
Blattgerste, J., Behrends, J., & Pfeiffer, T. (2022). A web-based analysis toolkit for the system usability scale. In Proceedings of the 15th International Conference on PErvasive Technologies Related to Assistive Environments (pp. 237-246).
@inproceedings{10.1145/3529190.3529216,
author = {Blattgerste, Jonas and Behrends, Jan and Pfeiffer, Thies},
title = {A Web-Based Analysis Toolkit for the System Usability Scale},
year = {2022},
isbn = {9781450396318},
publisher = {Association for Computing Machinery},
address = {New York, NY, USA},
url = {https://doi.org/10.1145/3529190.3529216},
doi = {10.1145/3529190.3529216},
pages = {237–246},
numpages = {10},
location = {Corfu, Greece},
series = {PETRA '22}
}
Developers

Prof. Dr. rer. nat. Thies Pfeiffer
Email: thies.pfeiffer@hs-emden-leer.de

Dr. Jonas Blattgerste
Email: jonas.blattgerste@gmail.com

Jan Behrends, B.Sc.
Email: jan.behrends@stud.hs-emden-leer.de


